View Modes
Examples on this page use the PyPI command instagram_monitor. If you chose another installation, replace that command with the matching command prefix. Keep all targets and options after the prefix.
Choose one of three ways to view monitoring activity:
- Traditional Text Mode: Standard CLI output, best for logging and background processes.
- Terminal Dashboard: A rich, interactive terminal interface with real-time stats.
- Web Dashboard: A modern web interface accessible via your browser.
Traditional Text Mode
Text mode is the default. It works in any terminal and is well suited to background processes.
- Every event is printed with a timestamp.
- Earlier events remain available in terminal scrollback and log files.
- It uses fewer terminal features than either dashboard.
Terminal Dashboard
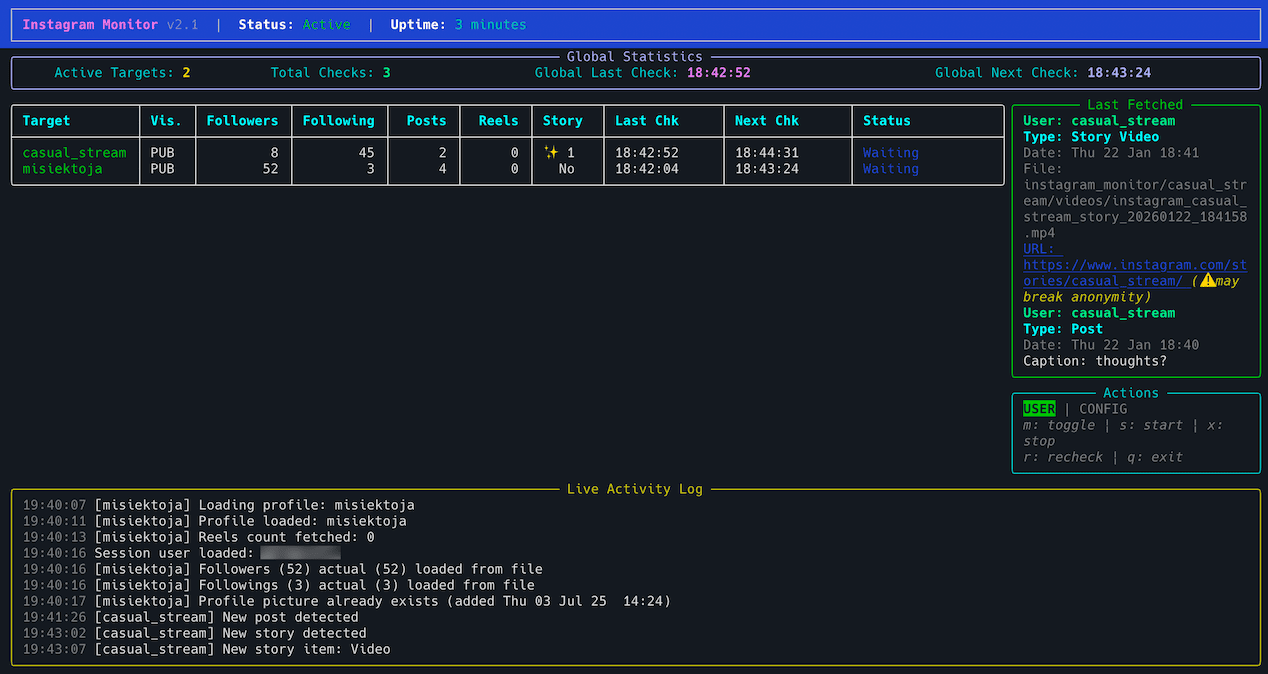
The Terminal Dashboard updates status, statistics and recent events in one terminal screen. It requires the rich library, which is included in normal installations.
Enable it with --dashboard or DASHBOARD_ENABLED = True.
Key Features:
- Visual Analytics: Real-time display of tracked targets with number of followers, followings, posts, visibility and story status.
- Live Activity Log: A scrolling view of the last few events.
- Interactive Toggles: Press 'm' to switch between 'User' and 'Config' views instantly.
- Remote Control: Start, stop or recheck monitoring for all targets directly from the terminal.
- Uptime & Status: Clean header showing tool version, status and total runtime.
Keyboard Shortcuts:
- 'm': Toggle dashboard view (User/Config)
- 's': Start All monitoring
- 'x': Stop All monitoring
- 'r': Recheck All targets
- 'q': Exit the tool
- 'h': Show help (lists commands in the activity log)
Web Dashboard
The Web Dashboard runs a small web server on your computer. By default, open http://127.0.0.1:8000/ in a browser on the same computer. The 127.0.0.1 address is local, so other devices cannot connect unless you change the server and Docker settings.
The dashboard has no login screen. Keep the host port bound to 127.0.0.1 and do not expose it through a public reverse proxy. Thumbnails and video playback use downloaded files only. Missing downloads show a placeholder. Saved webhook and proxy URLs are hidden. Enter a new URL only to replace the saved value.
View Story and story View controls in the activity feeds require confirmation before opening Instagram. The story owner may see the account signed in to Instagram in your browser, which can differ from the monitor's session. Use View Media or Play Video for downloaded content instead.
If the warning is missing, check Templates in the dashboard's Config view. An explicit WEB_DASHBOARD_TEMPLATE_DIR or --web-dashboard-template-dir takes priority. Otherwise, templates/index.html in the working directory takes priority over the installed template. Update that copy with the matching release, restart the dashboard and reload the page.
Request Protection
If a dashboard request is rejected, check these requirements:
- Accepted addresses. Use
127.0.0.1,localhost,::1orWEB_DASHBOARD_HOST. To use another name, add it toWEB_DASHBOARD_ALLOWED_HOSTS. Other addresses receive HTTP 403. - Settings and controls. Changes must come from the dashboard page and use
Content-Type: application/json. Requests from other websites receive HTTP 403. Requests without a JSON body receive HTTP 415.
Scripting the API yourself still works: send Content-Type: application/json and address the server as 127.0.0.1.
Invalid settings are rejected without applying other changes from the same save. Dashboard polling intervals range from 300 to 86400 seconds. When editing settings:
- CSV file name. Enter a filename without a directory. An absolute path already set through
CSV_FILEor-bis preserved. - SMTP password. If you change
SMTP_HOSTorSMTP_PORT, re-enter the password in the same save to keep email working. - ntfy access token. Changing the webhook server clears
NTFY_ACCESS_TOKEN. Changing only the topic on the same server keeps it. Set the token again in your dotenv file then reload withSIGHUPor restart.
In a container the server must bind to 0.0.0.0 so Docker can forward traffic. That value means every container network interface. It is not a browser destination. Use the published host address http://127.0.0.1:8000/ instead.
Key Features:
- Full Control Panel: Add or remove monitoring targets directly from the browser.
- Visual Analytics: Real-time display of tracked targets with number of followers, followings, posts, visibility and story status.
- Live Activity Log: A scrolling view of the last few events.
- Manual Trigger: A "Recheck" button to force an immediate update for specific or all users.
- Remote Management: Start or stop monitoring for specific or all targets with a single click.
- Synchronization: Saved settings and session changes take effect before the next check.
- Dynamic Configuration: Configure sessions and settings without touching the terminal or config files.
- Saved Targets: Press Generate Config on the Settings page to save the current targets and settings. The notification shows the generated
.confpath. Use that path with--config-fileon later runs. Unsaved target changes are lost on restart.
Enable it with --web-dashboard or WEB_DASHBOARD_ENABLED = True.
Flexible Usage:
- Standard Monitoring: Provide targets on the CLI and the dashboard acts as a live mirror and remote management interface.
- Control Panel Mode: Start the tool with only the
--web-dashboardflag (no initial targets). The script will wait for you to add users through the browser.
# Starting with initial targets
instagram_monitor target1 target2 --web-dashboard

# Starting as a pure control panel
instagram_monitor --web-dashboard
The Web Dashboard requires flask, which is included in normal installations. If it is missing, Instagram Monitor disables the dashboard but keeps console monitoring active.
Docker Compose exposes the default dashboard only at 127.0.0.1 on the host. Use docker compose up --no-log-prefix if setup enabled the Web Dashboard. For a one-off Compose command, add --service-ports. A plain docker compose run --rm starts the server but does not publish the service port:
Compose declares its host port even when the saved configuration disables the Web Dashboard. If port 8000 is already used and you do not need the dashboard, use the plain docker compose run --rm instagram_monitor ... form without --service-ports.
For a custom dashboard port, set the same port in instagram_monitor.conf and in the project .env used by Compose:
The Compose mapping then becomes 127.0.0.1:9000:9000. One-off commands printed by the tool use an explicit matching -p mapping for nondefault ports.
For direct Docker, add -p 127.0.0.1:8000:8000 before the image name. Replace both occurrences of 8000 when WEB_DASHBOARD_PORT uses another value. The complete mount and port forms are under Monitoring Mode.


Dashboard View Modes
Both dashboards offer two views:
-
User Mode (
user):- Simple, minimal interface.
- Focuses on core stats and latest activity.
- Ideal for "always-on" monitoring.
-
Config Mode (
config):- Detailed view showing all internal settings.
- Displays User Agent strings, Hour Ranges, Jitter status and more.
- Reports the identity in effect rather than the raw settings: the transport actually carrying requests, the browser
curl_cffiimpersonates onceAutohas resolved and the follower list source with its browser channel. Acurl_cffiselection that fell back because the package is missing is shown asrequests (curl_cffi is not installed). - Useful for auditing your setup and verifying configuration.
Switch views with the 'm' key in the Terminal Dashboard or the view button in the Web Dashboard.